Join
This page shows how to join two H3 hexagon datasets. This allows merging different datasets together to simplify analysis as each cell contains all the data.
This is particularly helpful when working with:
- Datasets in different spatial projections
- Sparse datasets like location data
- Datasets of different resolutions or types
Assumptions
We assume both datasets:
- Use
hexas the H3 hexagon column name (as would be the case for any ingested H3 dataset through Fused) - Are accessible at the same hex resolutions
Joining logic
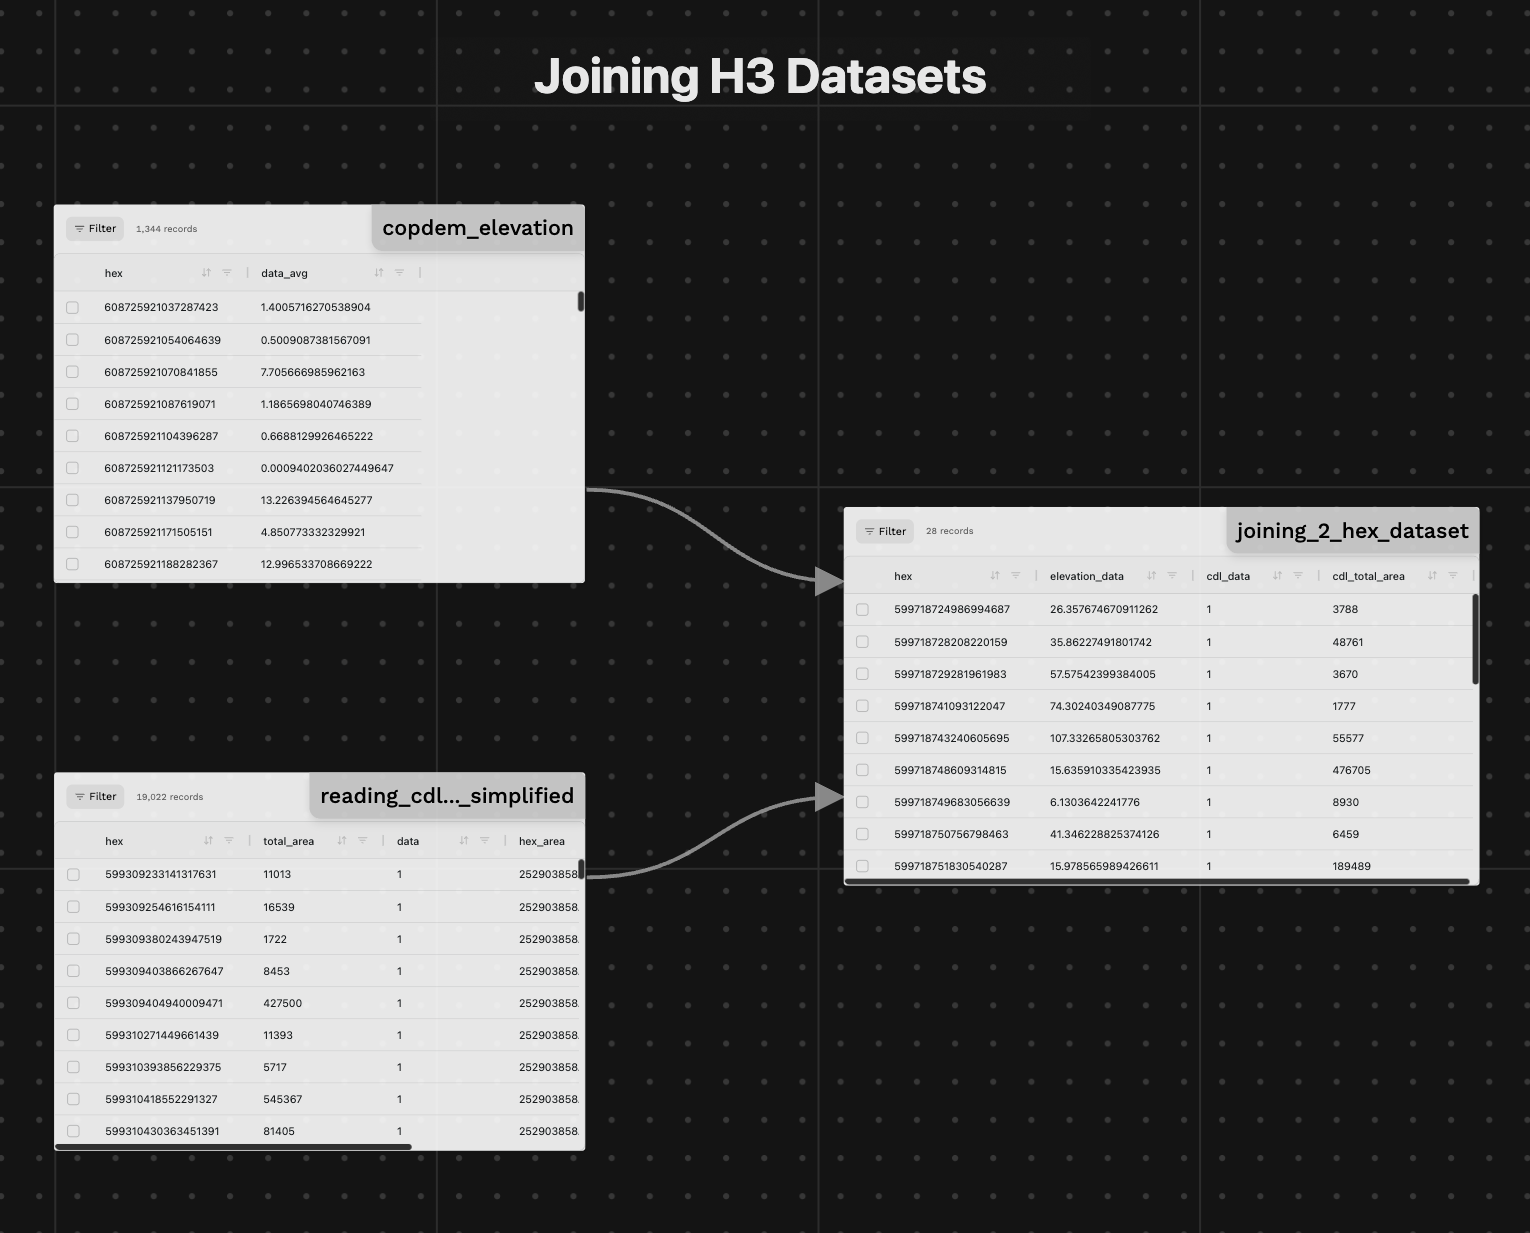
We use DuckDB to join the datasets together.
Using the example from the previous "Aggregate" section, we can join the elevation & crop data layer together.
Elevation dataset (UDF catalog link):
| hex | data_avg |
|---|---|
| 599718693687615487 | 14.60947 |
| 599718693687877631 | 31.12178 |
| ... | ... |
| 599718693688401919 | 23.30812 |
| 599718693688664063 | 45.28209 |
Crop Data Layer dataset (filtering to only show corn, i.e. data_value=1 UDF Catalog Link):
| hex | data | area |
|---|---|---|
| 600179630763671551 | 1 | 507124 |
| 600179630763671551 | 1 | 3537 |
| ... | ... | ... |
| 600181356234760191 | 1 | 172089 |
| 600191310987132927 | 1 | 801 |
We can join both tables together on the hex column:
@fused.udf
def udf(
    bounds: fused.types.Bounds=[-74.556, 40.4, -73.374, 41.029],
    res: int = 5,
):
    # These are the two datasets coming from the previous "Aggregate" section
    elevation = fused.run('copdem_elevation', bounds=bounds, res=res)
    cdl = fused.run("reading_cdl_2024_hex_simplified", bounds=bounds, res=res, data_value=1)

    common = fused.load("https://github.com/fusedio/udfs/tree/9a3aae2/public/common/")
    con = common.duckdb_connect()

    qr = f"""
    SELECT
        e.hex,
        e.data_avg as elevation_data,
        c.data as cdl_data,
        c.total_area as cdl_total_area
    FROM elevation as e
    LEFT JOIN cdl as c
    ON e.hex = c.hex
    """

    return con.execute(qr).df()
Returns the following table:
| hex | elevation_data | cdl_data | cdl_total_area |
|---|---|---|---|
| 599650080954204159 | 289.9432 | 1.0 | 74533290 |
| 599650080954466303 | 257.9233 | 1.0 | 90340230 |
| ... | ... | ... | ... |
| 599671053654220799 | 203.5272 | 1.0 | 97844060 |
| 599671261723484159 | 306.1185 | 1.0 | 121949200 |
Example
- Environmental Variable Exploration canvas merging all these variables into a single dataset:
- Crop Data Layer
- Land Irrigation
- Soil Type
- Temperature
- Precipitation